US stocks break a 3-week winning streak
Bonds continue to rally
Across-the-board losses for our strategy benchmark this week
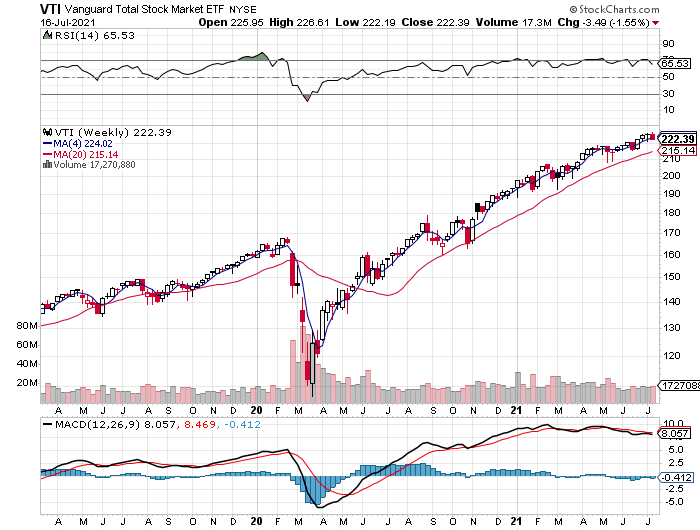
US equities take a beating: For most of the week, the bears ruled. When the trading ended today (Friday, July 16), Vanguard Total US Stock Market (VTI) gave up 1.5%.
The loss doesn’t look threatening. VTI continues to post the strongest upside momentum reading (see MOM column above). A quick glance at the weekly price chart below suggests no less. The weeks ahead could tell us otherwise, but for the moment VTI’s setback looks like one more correction in an otherwise bullish trending market. For details on all the strategy rules and risk metrics, see this summary.
US bonds are looking rather bubbly these days. Despite the release of hotter-than-expected inflation data this week, Treasuries show no sign of giving up their rally. The iShares 7-10 Year Treasury Bond ETF (IEF) rose for a third straight week, gaining 0.5% and ending Friday’s session just below a five-month high. Are Treasuries in a new bull market? It’s increasingly tempting to think so: IEF’s been trending up for several months, but its MOM rank of 60 is still middling and so the outlook remains moderately bullish at best by that score.
But thinking through how bonds may perform in the months ahead is tricky. In theory, if inflation continues to run hot, that’s probably bad news for bonds. But the crowd is increasingly of a mind that if inflation is more than a transitory play, the Federal Reserve will be forced to tighten policy. All the more so if you think that the central bank is far behind the policy curve ball and will need to play a muscular game of catch-up to keep inflation subdued. In that case, the economy could take a hit. Although the macro trend looks strong now, it’s not obvious that that’s economy’s underlying growth (sans federal stimulus) can stand tall against a run of Fed hikes. On the notion that it can’t, bonds look attractive (as they always do if recession risk is rising).
Meanwhile, commodities were this week’s top performer. WisdomTree Continuous Commodity Index (GCC) added 0.6%. Despite taking the top spot, GCC’s upside trend is looking weaker lately. The fund’s MOM ranking is a still-strong 80, but the potential for rolling over can’t be dismissed, or so the chart below implies.
This week’s biggest loss for our 16-fund opportunity set: US small-cap stocks, which got whacked. The iShares Core S&P Small Cap ETF (IJR) fell for a third week, shedding a steep 4.4%, settling at a two-month low.
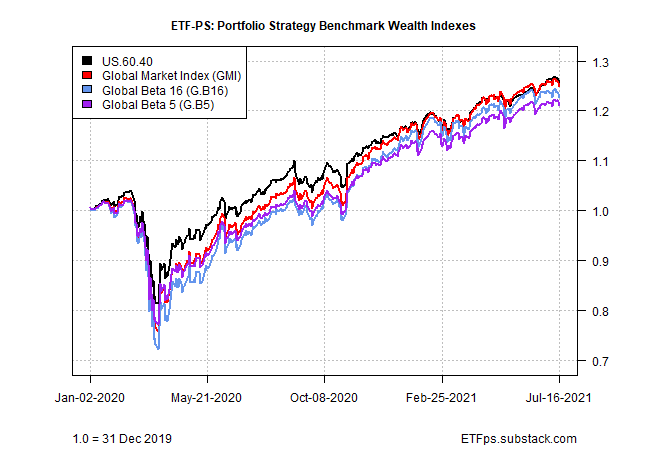
Nowhere to hide for the strategy benchmarks: It was a mixed week for our 16-fund opportunity set (as shown in the first table above), but there was no escaping red ink for our portfolio indexes.
The biggest loss struck in Global Beta 16 (G.B16), which gave up 1.1% this week. Global Beta 5 (G.B5), which covers the standard asset classes on a global basis with just five ETFs, had a relatively light haircut via a 0.7% weekly decline.
Despite the latest setbacks, all four strategy benchmarks continue to post solid year-to-date results. Note, too, that all four continue to hold on to 100 MOM scores, reflecting the strongest upside momentum readings. If there’s deeper trouble brewing for markets in the weeks ahead, it’s not yet showing up in price trends for our portfolio benchmarks. ■


