

The ETF Portfolio Strategist: 17 MAR 2024
Trend Watch: Global Markets & Portfolio Strategy Benchmarks

Markets took a step back last week, dispensing an overdue pullback after an extended run of weekly gains. If there’s a temptations to call a top, keep in mind that the technical profile suggests otherwise, namely: the party’s still intact, or so current trend analytics suggest.
The iShares Aggressive Asset Allocation ETF (AOA) eased 0.5% last week, its first weekly setback after nearly two months of nonstop gains. But the search for warning signs in the fund’s trend is virtually nil at the moment.
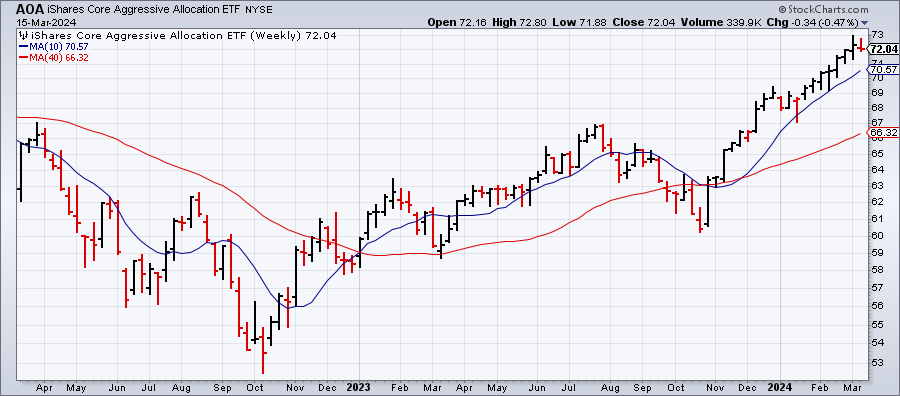
Conservative-oriented investors and dyed-in-the-wool contrarians may still be inclined to favor a defensive shift at this point. But until there’s clearer signaling in AOA and its counterparts, it’s not obvious that the clouds of risk-off are rolling in. Then again, every rally peaks and it’s only obvious in hindsight (at least in terms of high-confidence signaling).
On that note, AOA’s Signal Score remains strong: the current 5 reading is just one notch below the highest bullish score. AOA’s lesser risk brethren, however, toned down their degrees of hotness to a moderately bullish 3. See this summary for details on the metrics in the tables below.

Deciding with with full certainty in real time if a winning streak will roll on is impossible, leaving only the next-best option for medium/long-term investors who prefer reliability at the expense of timeliness. The drawback is that reasonably high-confidence signaling takes time, which means that you need a sufficiently long-enough time horizon to make this strategic preference viable.
On that assumption, even if markets have peaked and are now set for an extended slide, we’re still a month or two away at the earliest for drawing strong degrees of confirmation via market-trend analytics.
Consider, for instance, the rebound in US stocks (VTI), which started in late-2022. Using the 10-week and 40-week moving averages as one trend model, high-confidence signaling didn’t emerge until Feb. 2023 at the earliest.

But every model is subject to failure at times, and it’s never clear in real time when a false signal prevails. Consider the US Treasury market. Applying the 10-week and 40-week model to IEF suggests a bullish tailwind is once again blowing. But a similar shift was highlighted a year ago, which turned out to be wrong, and so investors are reasonably cautious re: dismissing the possibility that a repeat performance is in progress.

There are, of course, more models beyond a 10-week and 40-week moving average, and so the analysis above is only a toy example presented for illustration. Digging deeper to extract signal and minimize noise, in other words, is highly recommended.
Silver bullets, unfortunately, are still the stuff that dreams are made of. But reviewing market activity from multiple angles — the Impressionist approach to risk management, one might call it — is productive, up to a point. Using five complimentary modeling applications is usually a big improvement over relying on one. But the advantage gained in going from five to 20 will likely yield a lesser degree of enhancement, if any. In fact, noise is a clear and present danger when running too many models.
Fortunately, there’s a prudent starting point, and arguably it’s monitoring trend. Minds will differ over how to define and calculate trend, but a simple profile is a productive beginning. On that basis, markets are still signaling a bullish bias. That’s hardly the last word on the subject, but for now the burden of contrarian proof lies on the shoulders of the bears.