

The ETF Portfolio Strategist: 5 Feb 2023
Trend Watch: Global Markets & Portfolio Strategy Benchmarks

One of Wall Street’s enduring proverbs is Don’t Fight the Fed. But market sentiment has thrown the advice under the bus this year and turned a profit as a result.
It’s too soon to write the obituary for the adage, but the ongoing rally for most risk assets in 2023 suggests that the usual advice may not work as expected this year.
This much is obvious: upside momentum remains strong this year through Friday’s close (Feb. 3). Your perennially cautious editor isn’t ready to to ring “all clear” bell for risk assets, but that attitude adjustment appears imminent. The main reason I remain suspicious: the Fed’s hawkish persistence.
Yes, the degree of policy tightening is winding down — ergo last week’s 1/4-point rate hike, the softest since the central bank began lifting rates nearly a year ago. But the Fed still looks poised to raising rates further, albeit by relatively small 1/4-point increments. Even when the Fed reaches its assumed terminal rate — somewhere just north of 5%, or roughly 75 basis points above the current Fed target rate — it’s not obvious that rate cuts will commence forthwith.
If this is fodder to stay bearish, financial markets aren’t reading the memo and instead are inclined to price in better days ahead. Witness the continued rise in the strategy benchmark for our G.B16 opportunity set. The multi-asset-class index rose again last week and is now well above its 200-day moving average. Notably, its 50-day is above the 200-day average for the first time in nearly a year, a shift that suggests the upside momentum is more signal than noise. See this summary for design details on the strategy benchmarks.

As most markets around the world push higher, there’s more green on the screen for our proprietary momentum metrics, per the table below. As a result, it’s getting harder to dismiss this year’s rally as bear-market noise. For details on how the metrics in the table below are calculated, see this summary. Note that starting this week the trend metrics have been slightly revised in an effort to improve the momentum profiling. Details are provided in the summary.

Perhaps the most striking observation in recent market action is the recovery of US equities, which are now posting the strongest Signal scores.
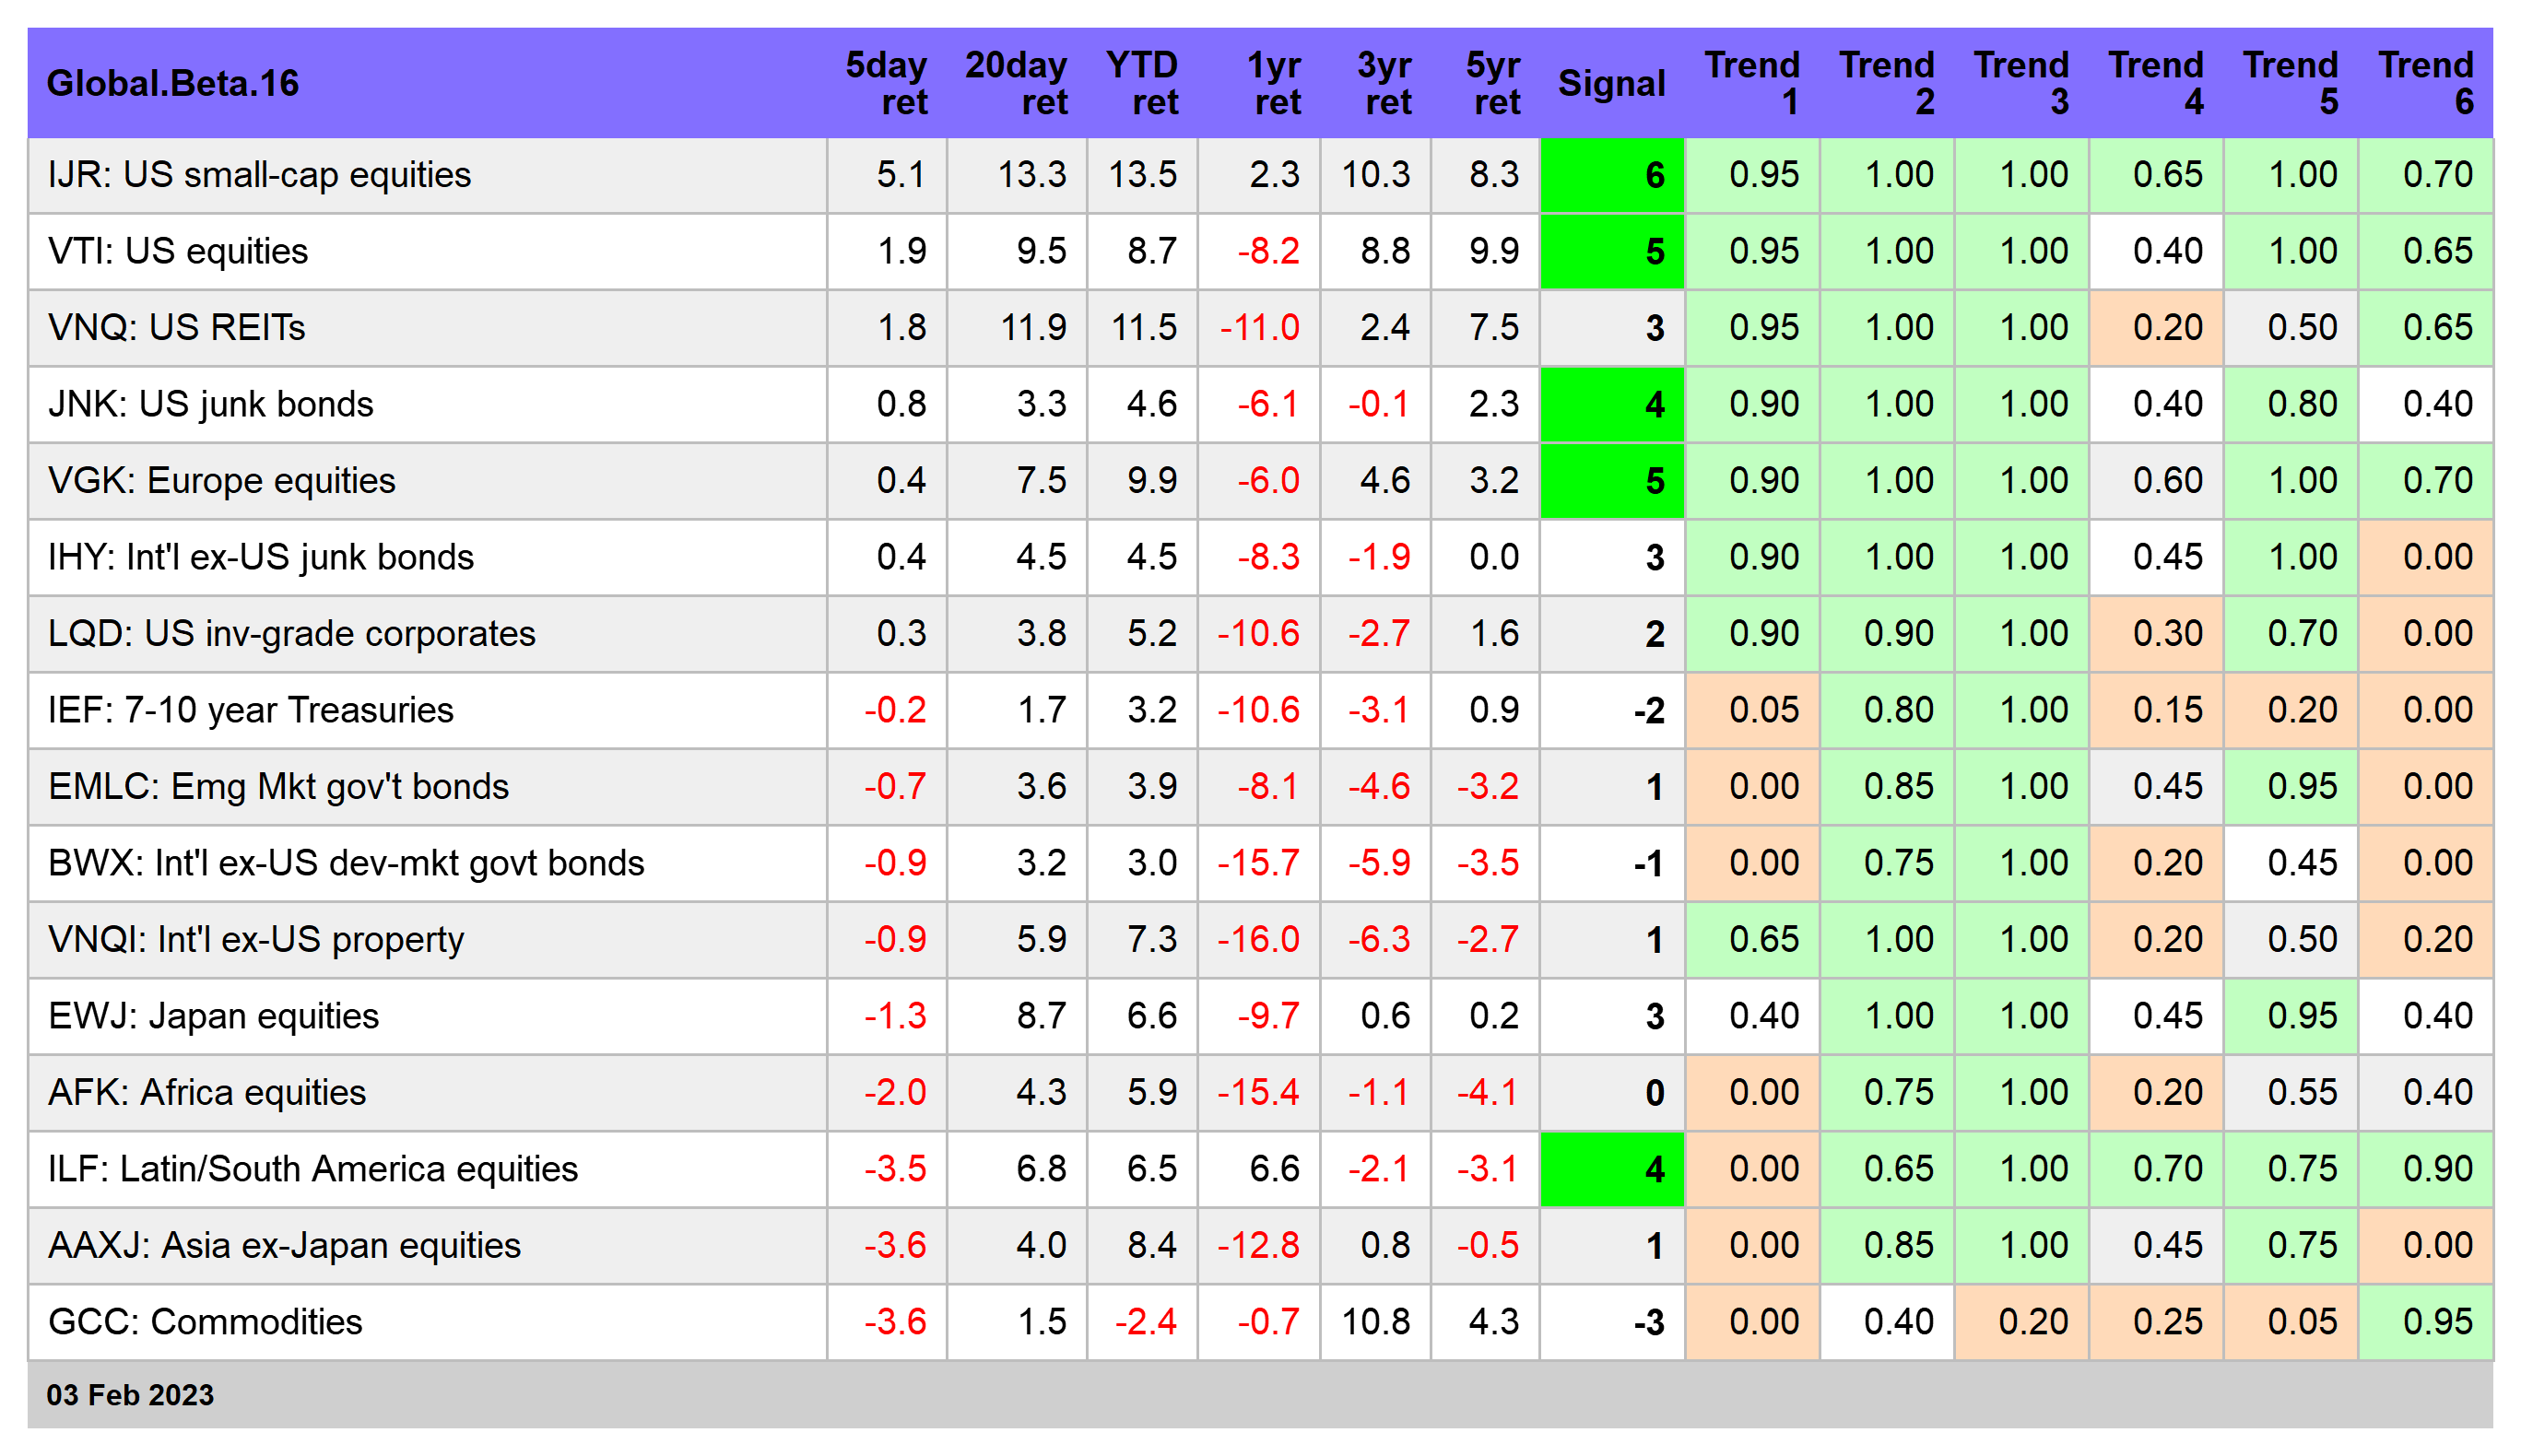
Small-cap stocks look especially strong. The iShares Core S&P Small-Cap ETF (IJR) rallied 5.1% last week. The gain lifted the fund above its previous two peaks, which suggests that the sliding trend of last year has been broken.

US Treasuries, by contrast, are looking vulnerable again. Although iShares 7-10 Year Treasury Bond ETF (IEF) has been more or less treading water in the past two weeks, the hawkish stance reaffirmed by the Fed on Wednesday suggests the recent rally in bond faces a new round of headwinds.

Perhaps the only salvation for fixed income will be more signs that the US economy is weaker than it appears via Friday’s blow-out gain in payrolls for January. Although a number of broadly-defined economic metrics suggest a weak if not negative macro trend, the labor market vociferously begs to differ.
Market trends tell the story: US stocks are looking increasingly bullish while US Treasuries are stumbling. The implied takeaway: recession risk is low, but the Fed will blink on raising rates further and inflation has peaked and will continue to slide.
That’s a high bar for a trio of expectations at this juncture, but the stock market thinks it’s plausible. If any one of those assumptions proves illusory, however, the start date for the next bull market for stocks may be further down the road than the crowd assumes. But that’s a minority view these days, raising the question: Is it timely to fight Mr. Market? I’m still inclined to answer “yes” and stay defensive, but my confidence with that risk posture is fading fast. ■