

The ETF Portfolio Strategist: 7 APR 2024
Trend Watch: Global Markets & Portfolio Strategy Benchmarks

Asset allocation strategies suffered their worst weekly setback of the year, but it’s premature to read too much, if anything, into the decline. The 0.8% slide for all the strategy ETFs shown in the first table below may feel unusually painful, but that’s only because the year so far has delivered an unusually smooth upside run.
The low-volatility rise for AOA and its counterparts had to end eventually, and perhaps that point has been reached. Deciding what comes next, however, is a work in progress, but the first order of business, as always, is monitoring trend as a possible/likely early warning of things to come.
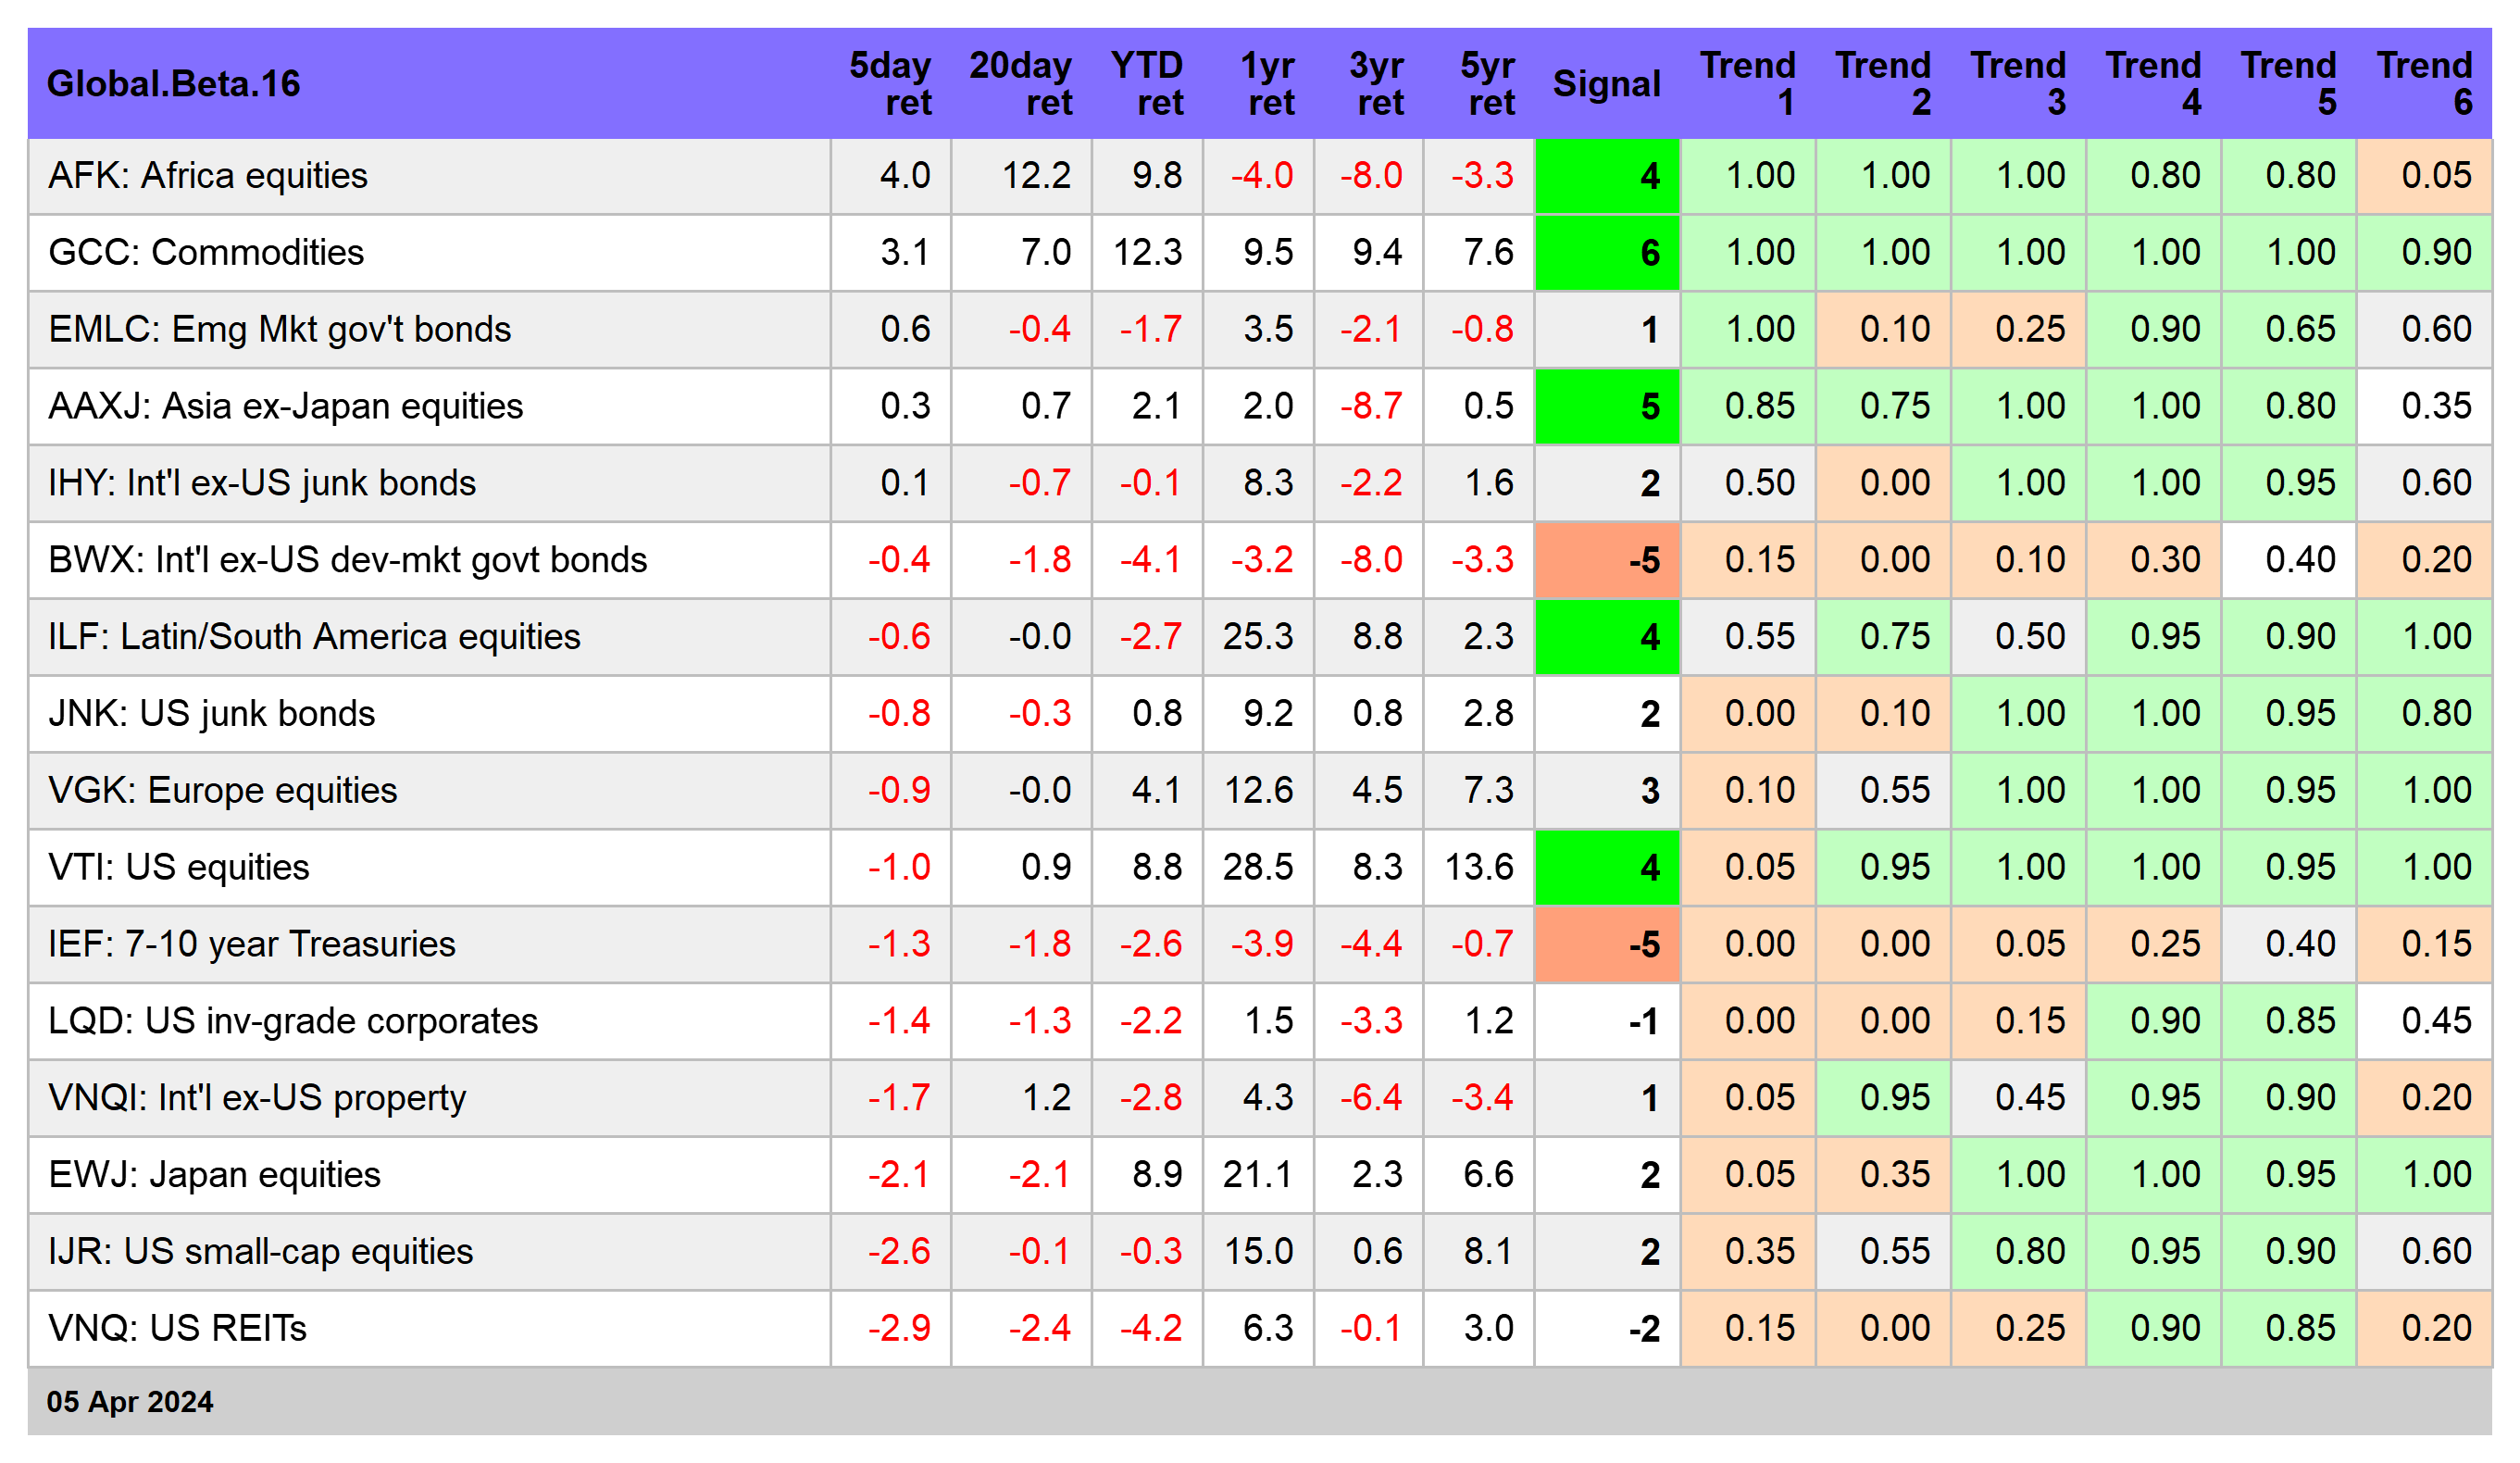
Let’s start by noting that our Signal score for the asset allocation ETFs has pulled back from last week’s across-the-board readings of 5, which is just one notch below the highest-possible bull-market score of 6. Today’s update is a mix of 3s and 1s. That’s still a net positive. Meanwhile, one weekly shift if hardly persuasive. The question is whether the lower readings persist and, more importantly, turn negative? See this summary for details on the metrics in the tables below.

Looking at AOA’s weekly chart reminds that we’re still far away from a convincing clue that the upside trend has ended. My guesstimate is that the unusually strong bull run in recent months is overdue for consolidating the gains of late. When or if the consolidating deteriorates into a negative run is the mystery. But if this is the top and markets are set for an extended slide, be prepared to wait weeks, perhaps a few months, for a high-confidence signal.

As a first approximation, a slide in AOA’s 10-week average below its 40-week average would be a smoking gun. At the moment, that crossover is nowhere on the near-term horizon, primarily because the rally in markets has been hot and quick since last October’s bottom.
Now’s a good time to revisit your risk tolerance, investment horizon and investment strategy. In other words, are you speculating, trading, or investing? Those terms can be loosely translated into short-, medium- and long-term horizons. If you’re in the short- or medium-term camp, taking some profits, perhaps aggressively, has appeal at the moment. The details on making that decision are beyond the scope of this article, but I’m a believer in the idea that when the market throws you a big gain in short amount of time, take it.
For longer-term investors, the decision-making process is more complicated. For perspective on that front, I’m closely watching the performance of US Treasuries, which continue to reflect a negative trend. IEF’s Signal Score is fell to -5, one tick above -6, the deepest bearish profile. That’s a sign that relief for the bond market is still further off into the future than recent history has implied.
A quick glance at IEF’s weekly chart below highlights what may be the resumption of a negative trend for Treasuries. The bond market rally in late-2023 fizzled this year as a mild retreat ensued. It’s still unclear if IEF is set to trend sharply lower and test 2023’s trough, but the possibility looks a bit more likely over the past week after the latest slide in Treasury prices.

Stocks this year have mostly ignored the ongoing revisions for the timing of the start of Federal Reserve interest-rate cuts, but that may be changing as the US economy continues to show resilience, which in turn is forcing the crowd to reassess assumptions for the outlook for monetary policy and bonds.
Fed funds futures are now pricing in a coin flip on whether the Fed cuts in June—a significant change from a few weeks ago, when a 70%-plus probability was the norm.
Friday’s payrolls report was seen as a wake-up call in some circles. Hiring accelerated more than expected in March, rising the most in nearly a year.
The news served as a reminder that the logic is weak for cutting rates at a time when payrolls are still rising at a strong pace. All the more so if this week’s consumer inflation report for March (Wed., Apr. 10) is hotter than expected. Economists forecast that headline and core CPI will tick higher on a monthly basis. Although the year-over-year trends won’t change much, core and headline CPI will continue to print well above the 3% mark, which means that the Fed’s 2% inflation target is still nowhere on the near-term horizon.
I expect that the path ahead for bonds will increasingly dictate the appetite for stocks. For the near term, the analytics will be challenging for the doves, which suggests that stocks will face stronger headwinds compared with the year to date.
The week ahead will be a key test for the bond market, which will likely be heavily influenced by the upcoming CPI data. IEF is is essentially trading at the bottom of its recent range. If that gives way, it’s going to be a lot tougher for the stock market to rally until deeper clarity about monetary policy and Treasury yields emerges.