

The ETF Portfolio Strategist: 18 AUG 2024
Trend Watch: Global Markets & Portfolio Strategy Benchmarks

Global markets rebounded for a second week. The revival of animal spirits suggests that the July sell-off was sentiment turbulence rather than a fundamental problem. Or so the optimists tell us.
For the moment there’s support for their view. From a US perspective, several key economic reports skewed in favor of the bulls — consumer inflation and retail sales, in particular, posted encouraging results. In turn, recent fears that the US economy has slipped over the edge into recession look overbaked, or at least premature. The US Business Cycle Risk Report (our sister publication) outlines some pushback to the revival of “everything’s fine” narrative in this week’s edition. Yet based on hard data in hand it’s almost certainly the case that growth endures. The fourth quarter may be on track for turbulence, but that’s a topic for another day.
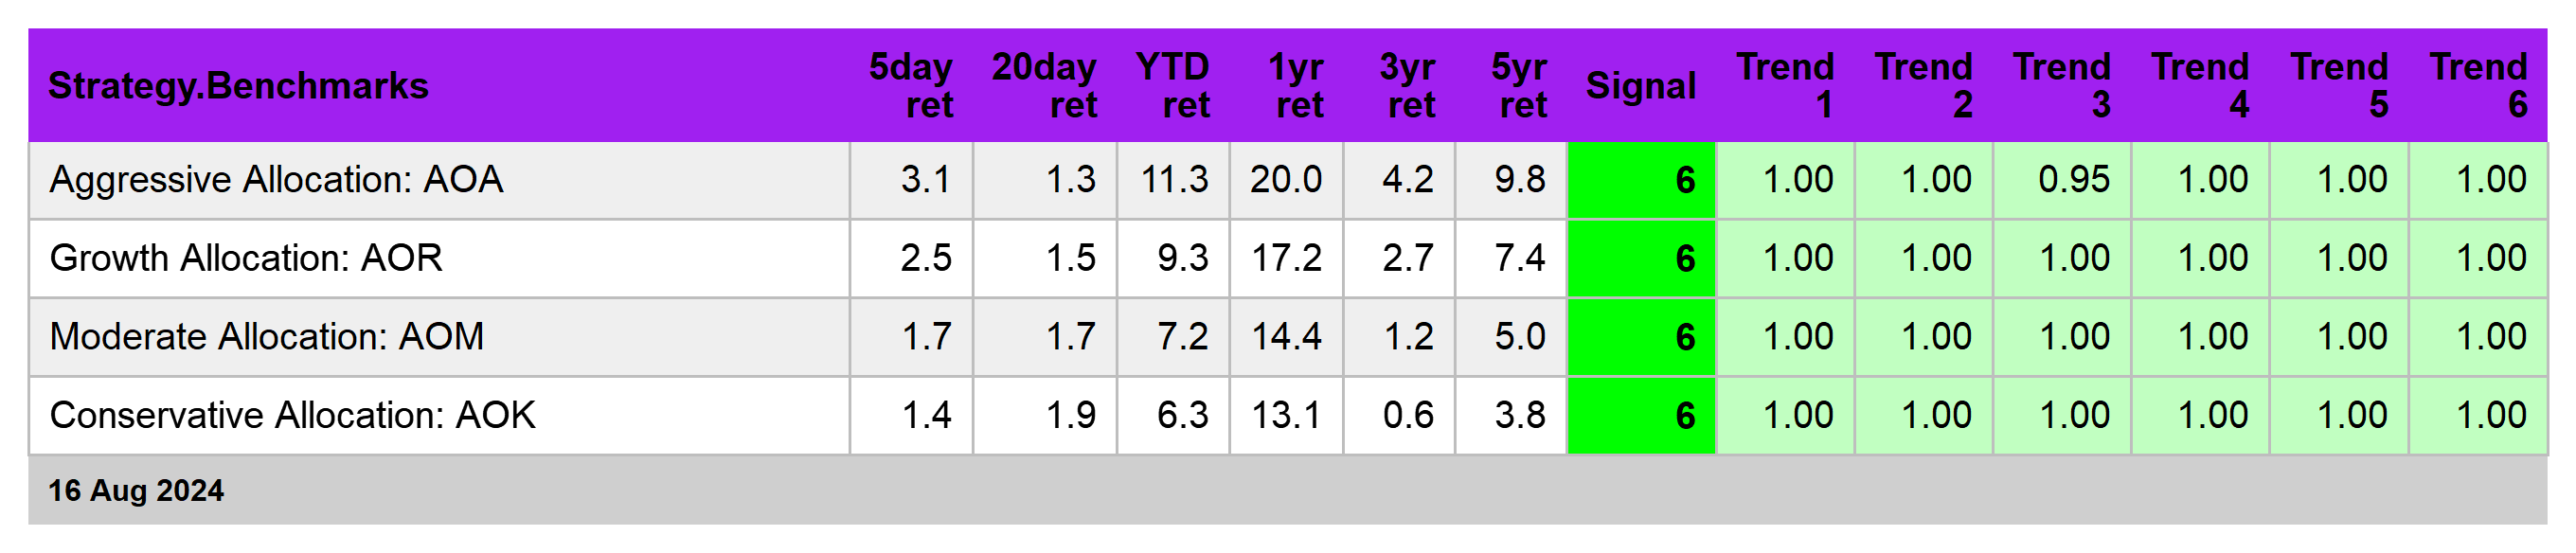
Meanwhile, our suite of global asset allocation ETFs posted uniformly positive numbers last week, led by the aggressive strategy (AOA), which surged 3.1%. All the funds are again posting solid performances for multiple time windows in recent history. In turn, our proprietary Signal score prints at a red-hot 6 for all the ETFs. See this summary for details on the metrics in the tables.
The question is whether the latest run of strength is noise in a bull market that’s past its expiration date? It’s still premature to assume the worst, but it’s also premature to conclude that the recent market volatility was a head fake. Rather, we seem to be an interim phase. It’s not unusual for prices to bounce higher after a sharp decline. So far, so normal.
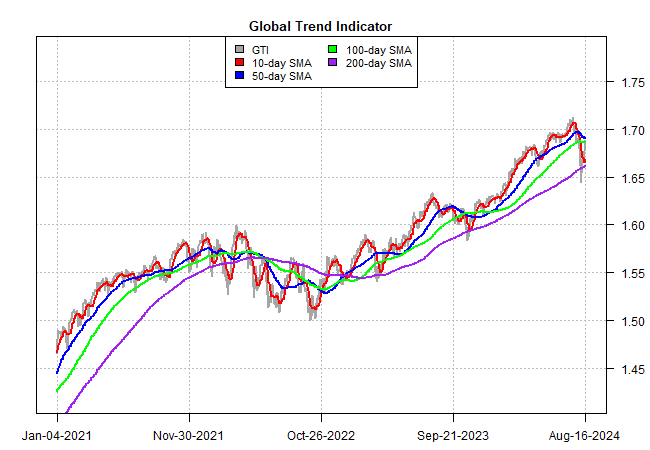
For perspective, I’ll be watching the evolution of the Global Trend Indicator (GTI), which summarizes relative trend behavior for the four asset allocation ETFs listed in the table above. The dive in GTI’s 10-day moving average (red line) has certainly caught my attention. Recall that two weeks ago I wrote: “I’ll be watching in the days ahead to see if the 50-day average (blue) drops below the 100-day average (green).” That hasn’t happened, but the weakness of late has brought us closer to that switch. If markets are genuinely recovering and headed for higher highs, it would be encouraging to see GTI’s 50-day average stay above its 100-day counterpart.
A closer look at global markets offers a degree of encouragement for expecting the party to continue. Indeed, green dominates the Signal scores in the table below, which tells us that investors are buying near and far. The same analysis discussed above applies below, but until there’s more evidence that we’re moving into a risk-off climate it’s reasonable to assume that the recovery has legs.

For investors with short time horizons, low risk tolerance, or both, now’s a good time to dial down on risk exposure. Short-term Treasury yields are still above 5% for maturities through 6 months while a 2-year Note still offers 4%-plus. For conservative-minded investors who’ve earned solid returns from risk assets over the past year, taking some profits and parking it in safe havens with decent yields strikes me as a reasonable adjustment.
By contrast, long-term investors, as usual, can look through recent events. The intermediate-horizon folks, by contrast, have their work cut out for them for deciding what, if anything, to do. For now, I’m leaning into sit-tight-and-sleep-with-one-eye-open guidance. That’s not pariticularly satisfying, but markets will likely dispense clearer signals in the weeks ahead. ■