The ETF Portfolio Strategist: 4 AUG 2024
Trend Watch: Global Markets & Portfolio Strategy Benchmarks
The next update of The ETF Portfolio Strategist: Aug. 18
The overvalued excess that has inhabited equity markets lately (the US in particular) finally took a toll. Surprising? Not particularly. As our sister site, CapitalSpectator.com, noted a mere three weeks ago, “US Stocks Look Overbought.”
On these pages as well we advised on July 7 that while technical signals remained bullish, “rebalancing a multi-asset-class portfolio looks timely.”
Granted, highlighting the “wisdom” of the rear-view mirror can be dismissed as cherry-picking previous commentary to favor your editor’s analytics in the best-possible light. What about all the ill-timed comments previously? One might start by correctly observing that from a qualitative perspective the cautious views of this newsletter have been early… for months.
Fair enough. We’ll leave it to readers to sort out the value, if any, of commentary on these pages. Meantime, there’s more important work to do for evaluating where we stand in real time and what that implies for the future. As always, caveat emptor.
Perhaps the most salient fact from last week’s trading: Decisions at the asset allocation level can be meaningful in times of relatively high market stress. Using our standard set of semi-passive, multi-asset globally diversified ETFs, it’s notable that the conservative (AOK) and moderate-risk (AOM) strategies posted gains last week. By contrast, the growth (AOR) and aggressive (AOA) asset allocation funds took a hit, per the table below.
Even more striking , the conservative (AOK) and moderate (AOM) allocation strategies are still posting solidly bullish Signal scores. Defense, in other words, paid off handsomely last week. See this summary for details on the metrics in the tables.
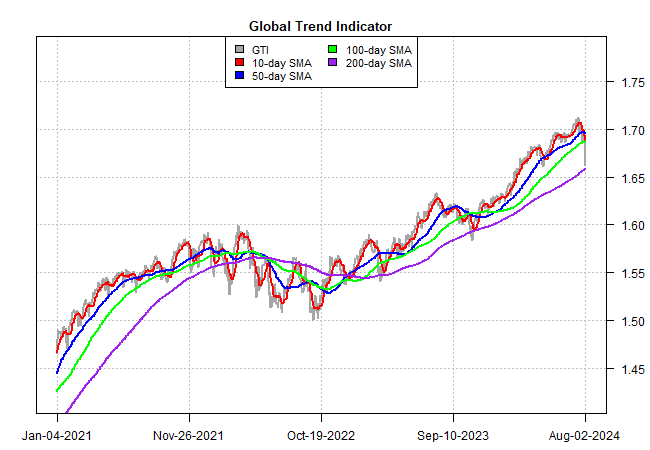
Stepping back and considering the big picture, however, suggests regime change may be imminent, based on the Global Trend Indicator (GTI), which analyzes relative trend behavior for the four asset allocation ETFs listed in the table above. The sharp deterioration in GTI last week (grey line) isn’t easily dismissed. The fact that it crashed through its 10- and 50-day averages quickly confirms what was probably already obvious for anyone following markets on Thursday and Friday: the bullish profile faded in Hemingway-like fashion: gradually, then suddenly.
Adding to the sense of concern that the slide is starting to look like signal rather than noise: GTI’s 10-day average (red line) fell below its 50-day counterpart (blue line).
But all’s not lost, at least not yet. I’ll be watching in the days ahead to see if the 50-day average (blue) drops below the 100-day average (green). That doesn’t look imminent, unless last week’s selling accelerates in the week ahead.
A more worrisome sign, and arguably one that would provide strategic confirmation of a bear-market trend, would arrive when GTI’s 100-day average (green) falls below the 200-day index (purple). On that score, there’s still a long way to go.
But in a sign of the times, the appetite for risk-off has surged in recent days, as the score board below suggests for mapping a relatively granular profile of global markets. The crowd, in other words, has started flirting with a risk-off mindset. Indeed, Vvirtually all of the green (high Signal scores) in the table below is concentrated in bonds. The lone exception: US small-cap stocks (IJR).
From a US perspective, quite a lot of the selling late last week was triggered by fresh anxiety about rising recession risk for the world’s largest economy. In turn, that attitude adjustment unleashed a stampede of safe-haven buying via Treasuries (IEF).
The question before the house: Is a US recession a forgone conclusion? The odds have arguably increased, following a string of relatively weak updates for the labor market. But as discussed in the new issue The US Business Cycle Risk Report (yet another publication from yours truly), a broad set of business-cycle indicators have yet to issue a high-confidence signal that a downturn has started or is imminent.
Keep in mind that there’s still room for debate about whether the softer-than-expected rise in US payrolls in July was noise or signal. Although the Labor Dept. advises otherwise, some analysts explain that Hurricane Beryl temporarily disrupted the data. It’s been clear for some time that growth in the labor market has been decelerating, but the positive spin is that weather’s to blame for what, on its face, looks like a hefty deterioration in what previously appeared to be a soft-landing scenario vis-a-vis hiring.
Alas, it’ll take at least another month to fully test that view. Meantime, we’ll be watching the data releases in the week ahead to help clarify the outlook, starting with US PMI survey data tomorrow and the ISM Services Index for July (Mon., Aug. 5). For hard data, keep an eye on initial jobless claims (Thurs., Aug. 8), which rose to a 1-year high for the week through Jul. 27. A substantial increase in the next update would tough to overlook and present a deeper threat to the optimistic view. ■


