

The ETF Portfolio Strategist: 29 JUNE 2025
Trend Watch: Global Markets & Portfolio Strategy Benchmarks

When markets are trending, it’s usually best to get out of the way and let beta do the heavy lifting. The advice continues to resonate in the current climate.
Markets continued to rally last week, shrugging of the Iran-Israel-Iran conflict (and pretty much anything else you can think of). Just a week ago the world was on edge following the US bombing of Iran’s nuclear sites. It looked more than a little worrisome, but calm quickly returned as the fighting stopped and market sentiment resumed its bull run.
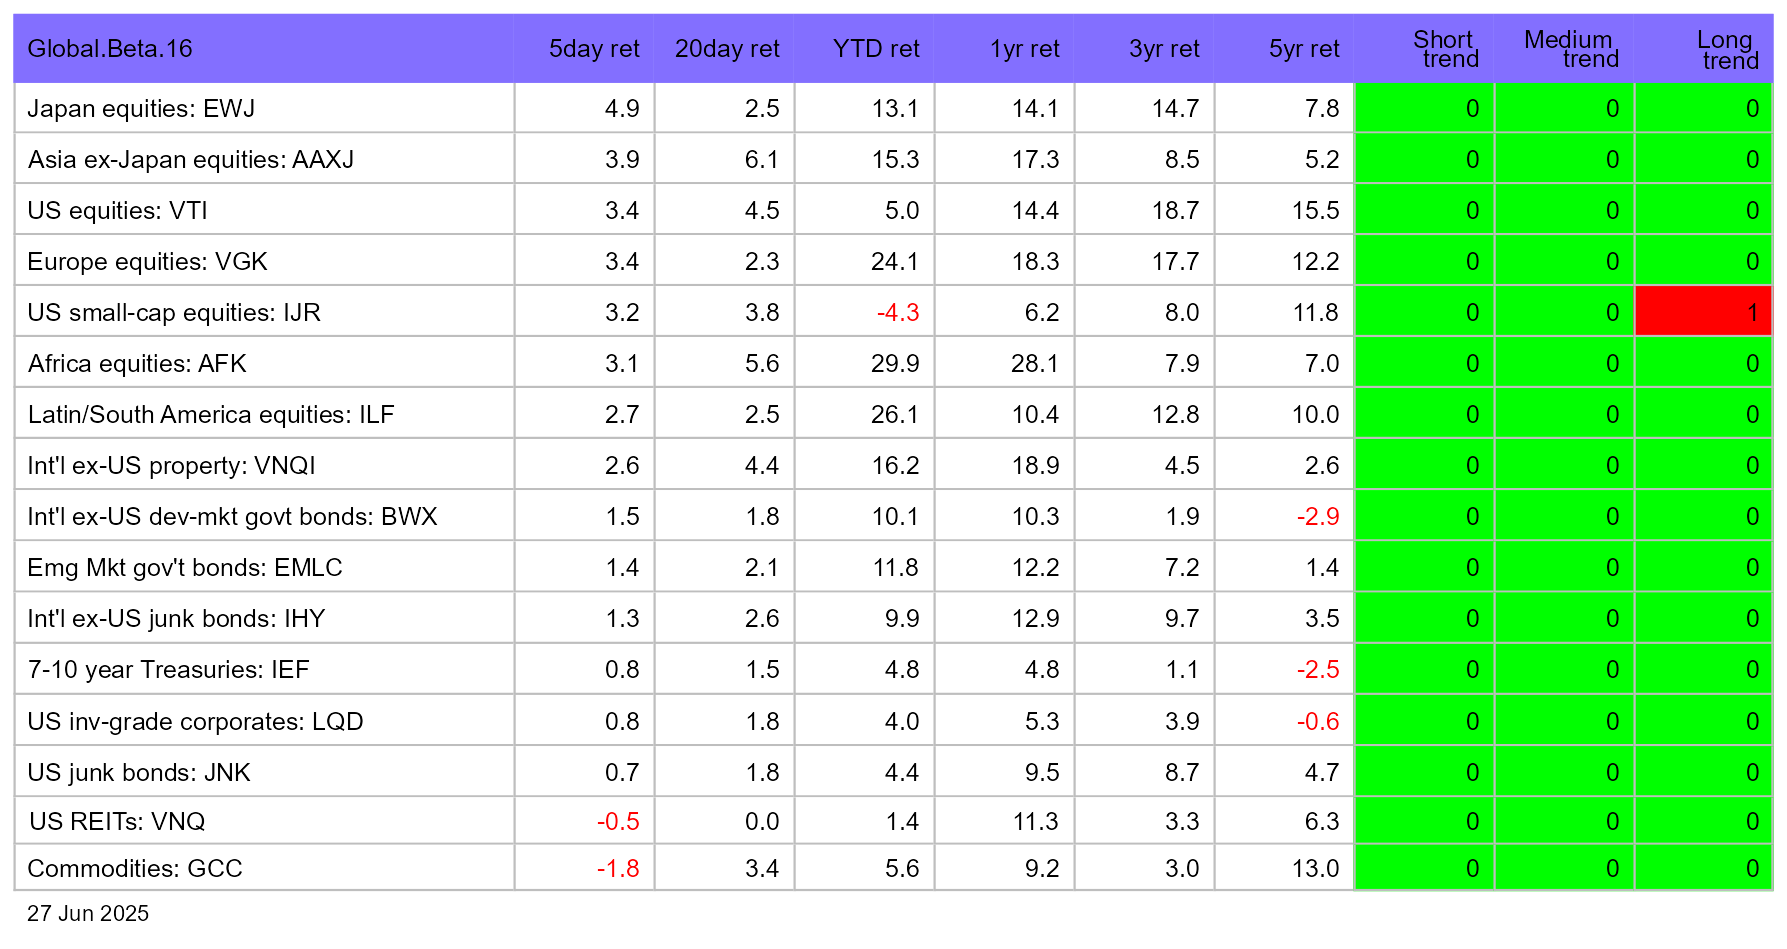
All four proxy ETFs for global asset allocation posted strong gains last week, which kept the trend indicators pinned to bullish for the short, medium and long horizons.


Drilling down into global markets reminds that the bullish bias remains strong in nearly every corner. There’s a whiff of reluctance in US small caps (IJR) to join the party, but even this battered corner of markets (posting the only loss year to date in the table below) dispensed a solid gain last week.
There’s still plenty to fret over, but if the crowd is dismissive of the risks it’s questionable if betting otherwise is prudent at the moment. For investors with low risk tolerance, short-term liquidity needs, etc., a case can be made for adopting a defensive position. As noted below, there’s some not-insignificant macro risks brewing on the horizon for the US. But for most investors (at least those with a sufficiently long time horizon and average risk tolerance), riding the trend still looks reasonable, even if it raises anxiety for some of us.
The logic for going with the flow draws on the bullish trend that shows no sign of stopping. Consider the aggressive global asset allocation ETF (AOA) via weekly data below. Following the 2.8% increase in the fund last week, the trend could hardly look much stronger. Perhaps we’re overbought here, which is worth pondering. But the collective wisdom of the crowd is speaking rather clearly as we write.

Contrarians will be quick to point out that trouble could be lurking on several fronts. But until markets are showing signs of pricing in some of that risk in a meaningful degree (i.e. a degree of downward trending price behavior), it’s prudent to assume that the bulls will continue to dominate.
It looked like the tariff tantrum in April was the tipping point for the downside, but that turned out to be another head fake. Easy to say now, of course, although in real time there a case for staying calm and looking through the short-term volatility as long as the long-term trend indicator for the asset allocation funds listed above remained in a risk-on posture (as it did — see this Apr. 27 and May 2 updates, for instance.
It’s obvious what we should have done in the past, but making decisions related to the future is a different beast altogether. It’s also the perennial task for every investor, save the rare individual or institution that’s truly focused on the very long-term and expresses that view with a genuine buy-and-hold strategy subject only to minor periodic tweaks around the edges. For everyone else (including yours truly), the game is one of trying to make informed decisions about what look’s probably (or not) and translating that into portfolio strategy.
Alas, I don’t have forecasts that aren’t to the usual issues, but I do have two hefty macro issues to contemplate as I monitor the data and adjust expectations accordingly. First up is the fast-approaching July 9 deadline for US tariff deals. The burning question: Will President Trump extend the deadline and avoid what could be another messy chapter in the (so far) lack of concrete progress vis-a-vis negotiations that satisfy the White House? Absent a deal, tariffs look set to rise and reverse the pause announced in April.
Trump’s latest comments on this subject have been less than clarifying (to no one’s shock at this late date). Asked on Friday if his July 9 will hold, he responded: “We can do whatever we want. We could extend it. We could make it shorter.” He added:
We’ve made a deal with probably four or five different countries. We have 200 countries, you could say 200 countries plus,” on the list of country-specific tariff targets from April.
So at a certain point, over the next week and a half or so, or maybe before, we’re going to send out a letter, we talked to many of the countries, and we’re just going to tell them what they have to pay to do business in the United States, and it’s going to go very quickly.
The guessing game, in short, continues. But this much seems clear, at least to your editor: the non-zero possibility of a significant market reaction if the deadline triggers a widespread jump in tariffs. Doesn’t the false signaling of the April tariff tantrum suggest we can safely ignore another pivotal event for tariff risk? The answer depends on how you define “safely.” I’ll conveniently sidestep that topic for now.
Meanwhile, Trump’s One Big Beautiful Bill (OBBB) is advancing through the Senate and looks set to land on the President’s desk, perhaps in the days ahead. Signing it into law would mark a crucial political win for the White House and Republicans. The problem is that most analysts project that it will significantly add to an already bloated federal deficit, which in turn has implications for interest rates and inflation. Trump and the GOP are downplaying the risks, but let’s note that debate is, to put it mildly, robust on this point.
“As it currently stands, the Senate reconciliation bill is likely to add $3.5 to $4.2 trillion to the debt through Fiscal Year (FY) 2034, based on our estimates,” the non-partisan (if such a thing is still possible) Committee for a Responsible Federal Budget, a think tank, wrote last week.

To be fair, projections at his stage are somewhat warm and fuzzy. Different think tanks come to different conclusions, although the generate read is that the red ink will deepen.
The immediate question is whether markets will react if OBBB becomes law? If that’s the path of least resistance, it’s not yet obvious. As the weekly chart for the US 10-year yield reminds, the benchmark rate continues to trade at a middling level relative to recent history, closing a 4.28% on Friday.

One reason is that while OBBB implies higher interest rates, there’s some evidence that the economy is slowing, a factor that implies the opposite for yields. The latest hint: US consumer spending unexpectedly fell in May, the government reported. Not enough to raise recession risk for the immediate future, but enough to persuade some corners of the market that the Federal Reserve will soon be forced to cut rates to juice economic activity. Fed funds futures are pricing in a 90%-plus probability that the Fed will cut in September.
Will one or both of these risk factors slow if not derail the risk-on party? Hold that thought as the next major piece of economic news comes into focus: nonfarm payrolls for June (scheduled for release on Thurs., July 3).
Markets appear to remain unconcerned of the potential risks, preferring instead to party on. Will that sentiment hold up in the trading week ahead? Great question, and one that we’ll be focused on here in the editorial bunker, where our surveillance of the data continues as we attempt to separate signal gold from the gravel of noise. ■
Oh, you are right. I meant I'd like to see updates of your "Global Trend Indicator". Such as this post: https://etfps.substack.com/p/the-etf-portfolio-strategist-27-apr
Well written thanks. Lots to think about.