

Using Risk To Reverse Engineer Return Premia Estimates

The market gods have cursed investors by decreeing that expected return is the most important variable in portfolio design — and also the most challenging for developing robust estimates. How to proceed? Carefully, cautiously, and with an above-average dose of humility.
With that caveat aside, let’s run some fresh numbers for modeling expected risk premia for the major asset classes by way of representative ETFs. To be precise, the projections below are returns over the “risk-free” rate. The goal here is to develop broad estimates, primarily for relative comparison – stocks vs. bonds or REITs vs. commodities, for example.
The basic setup: piggyback on a model originally outlined by Professor Bill Sharpe in a paper that uses three risk inputs to develop long-run return projections:
1) An estimate of the market price of risk (Sharpe ratio) for the total market portfolio, which is our Global Market Index — an unmanaged benchmark that holds all the major asset classes (except cash) in market-value weights via proxy ETFs.
2) volatility (standard deviation) of each asset.
3) correlation for each asset with the overall portfolio (GMI).
Ideally, all the inputs would be ex ante numbers, but as a first approximation all the data are drawn from the historical record since the close of 1997 via ETFs. The projected risk premium for each asset class is calculated as the product of the three inputs above. GMI’s ex ante risk premia is computed as the market-value-weighted sum of the individual projections for the asset classes.
Here’s how the projections stack up (in table format followed by a barchart for easier visual comparison):

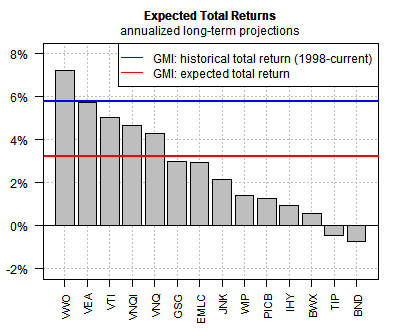
The expected risk premia range from a high 7.2% annualized for stocks in emerging markets (VWO) down to a modestly negative performance for broadly defined US investment-grade bonds (BND). For GMI, the outlook is for a modest 3.2% annualized risk premium – well below the 5.8% that’s prevailed since the end of 1997.
The basic forecast: earning a risk premium with a multi-asset-class portfolio will be considerably more challenging in the years ahead vs. the past two decades-plus.
Ah, but no one’s required to hold GMI, although in the aggregate everyone owns this portfolio, which is why it’s an obvious benchmark. But we digress. As to the possibility of earning something better than GMI’s results, one could take several paths, including: reweighting a portfolio to take advantage of higher expected risk premia. In theory, this approach can overcome some (most?) of the expected return headwinds. The question, of course: How much confidence do you have in the risk premia estimates?
The basic rule is that the aggregated estimates via GMI are more reliable than the individual estimates. Therein lies a particular type of risk: going too far with overweighting a portfolio with higher-expected-performance assets reduces diversification (relative to Mr. Market’s mix). In turn, the reliability of the resulting portfolio’s return estimates may suffer.
Par for the course in the art/science of designing/managing portfolios and attempting to find the best blend of risk and return. But if the numbers above offer one relatively clear forecast, it’s this: foreign stocks appear to offer higher ex ante risk premia. Exactly how much higher is open for debate. That leaves us with an even bigger question: How far to go down the rabbit hole?
In an upcoming issue of The ETF Portfolio Strategist we’ll dig a little deeper into this topic in search of perspective.
Meanwhile, here’s a fresh update of our usual benchmarks, followed by brief definitions:

US.60.40: US stock/bond portfolio, rebalanced every Dec. 31
GMI: an unmanaged global portfolio that holds the major asset classes in market-value weights
G.B4: a twist on GMI that reduces holdings to four broadly defined ETFs that target global exposure to stocks, bonds, real estate and commodities. Weights: 60% stocks, 30% bonds, 5% real estate and 5% commodities. The portfolio is rebalanced every Dec. 31.
G.B15: an expanded version of G.B4 via 15 ETFs that slice and dice the world’s major asset classes into a more granular portfolio design. The overall allocation still matches G.B4: 60% stocks, 30% bonds, 5% real estate shares and 5% commodities.