In this issue:
Inverse together: interest rates rise and (most) stock markets fall
Portfolio strategy benchmarks take a hit after two weeks of gain
US equities on the defensive as Treasury yields continue to rise: Maybe it wasn’t solely about the ongoing upswing in rates, but it probably didn’t help. Whatever the reason(s), US shares fell 0.7% this week through Friday’s close (Feb. 19), based on Vanguard Total US Stock Market (VTI). The ETF posted its first weekly decline in three weeks. That still leaves the fund close to a record high, which was set only a week ago. But with interest rates rising, and showing an increasingly robust upside trend, the burning question is: How much tolerance can equities muster if the reflation trade for yields rolls on?
US equities had plenty of company with downside pricing this week. As our standard 16-fund opportunity set (global proxies in the aggregate for the major asset classes) shows below, red ink dominated this week. Among the big losers: US investment-grade bonds (Treasuries and corporates).
The iShares 7-10 Treasury Bond ETF (IEF) continued to slide this week, tumbling 1.1% to its lowest close since last March.
US corporates also took a hit this week — down 1.1% via iShares iBoxx $ Investment Grade Corporate Bond (LQD). Note that both IEF and LQD have been on the sell list all year via one of our proprietary strategies: Global Managed Drawdown (G.B16.MDD) -- see, for example, this Feb. 15 update. Perhaps at this late date it’s not surprising that our proprietary momentum indicator (see the MOM column in the table above) has been routinely profiling IEF with deeply negative trending behavior. Keep in mind, however, that another proprietary strategy — Global Managed Volatility (G.B16.MVOL) has yet to fall in on the risk-off bias for bonds, and so we’re arguably still in a gray area. Stay tuned. For details on strategy rules and risk metrics in this article, see this summary.
While there was no shortage of losses this week, there were a handful of upside outliers. In particular, Africa stocks continued rising, posting a third straightly weekly advance. VanEck Vectors Africa (AFK) -- the strongest among a trio of gains this week for our global opportunity set. Commodities (GCC) and international junk bonds ex-US (IHY) also eluded this week’s financial gravity.
For the year so far, most corners of global markets are still posting gains – relatively substantial gains in some cases. But red ink is creeping back in to picture. The key question: will rates continue to rise? If so, we’ll likely see more numbers in the YTD column fade to red.
For the moment, recent trending behavior favors higher rates. The 10-year Treasury yield rose to 1.34% today – highest in nearly a year – and continues to post a technically strong upside bias via the 50-day average opening a wider gap over the 200-day average. Until there’s some convincing economic and/or policy news to trigger an attitude adjustment, our baseline outlook is for rates to trend higher.
That doesn’t mean that rates are due to spike up – a gradual increase is plausible and arguably the more likely path, albeit with plenty of backing and filling along the way. Economically, one can also argue that higher rates reflect reviving economic optimism, in which case the damage to stocks may be limited or perhaps non-existent. Nonetheless, rising rates are the new kids in town these days and adjusting to the change may take some getting used to with regards to pricing risk assets.
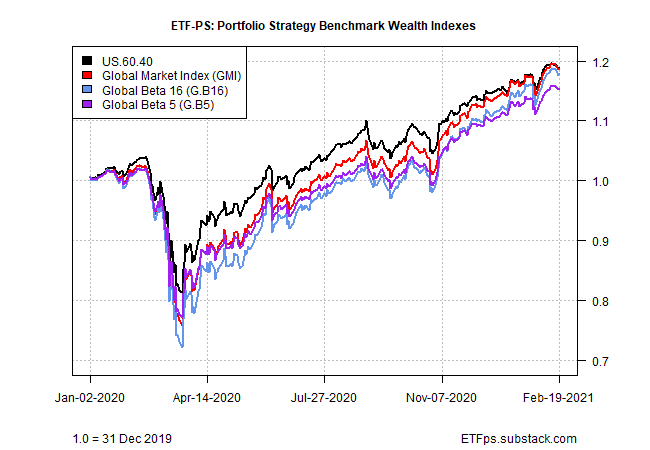
Portfolio strategy benchmarks fall: Strategy beta tumbled this week. All three of our global portfolio benchmarks slumped, along with the US 60/40 stock/bond portfolio (US.60.40) -- marking the first declines in this space in three weeks.
The setbacks were relatively modest, ranging from a 0.5% retreat for the Global Beta 5 (G.B5) to a 0.7% fall for US.60.40. Year to date, however, all four strategy benchmarks continue to post solid gains. The trailing one-, three- and five-year results are still strong as well.
For the moment, trending behavior remains bullish for the strategy benchmarks, but it wouldn’t be surprising if the party takes a breather. Whatever happens, keep a close eye on the evolving yield trends and incoming inflation data. Until further notice, these are likely to be major influences on risk-asset pricing. ■


I have a question about how you calculate returns for portfolio benchmarks like G.B16 and G.B5. My question is about dividends paid by the underlying ETFs. I assume (but I am not sure, hence my question) that you calculate the total returns (divs included) for each ETF. That means, if I am following your strategy with real money, I would re-invest the dividends from one ETF into additional shares of the same ETF (as opposed to (for ex.) spreading the dividend money over all ETFs in proportion to the desired allocation). Once a year I would assess how much I have in each ETF and rebalance among them to restore the desired percentage allocations shown above. Is this a fair summary of the procedure that your calculations reflect? Thank you.