The ETF Portfolio Strategist: 21 JUL 2024
Trend Watch: Global Markets & Portfolio Strategy Benchmarks
Please note: The ETF Portfolio Strategist will not publish next week due to travel plans. The next issue is scheduled for August 4.
Markets had a rough ride last week, but at this point it’s premature to see the slide as anything more than noise. Yes, your editor has been getting a bit twitchy lately, noting at the start of July that “rebalancing a multi-asset-class portfolio looks timely.” But I also recognized last week that “the trend is your friend, until it’s not.”
Deciding when and how to rebalance starts with market analytics, but key inputs also include your risk tolerance, time horizon, investment objective, and other factors that are unique to you. The generic factor for everyone is the market variable, which is the focus on these pages.
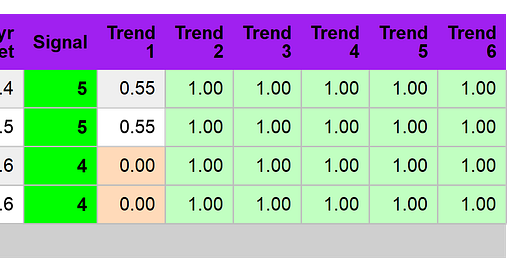
A robust calculated risk estimate for deciding which way the market wind’s blowing is time well spent. On that score, the bulls still have the upper hand, or so a number of trend metrics suggest. That includes our proprietary Signal scores for a set of global asset allocation ETFs, which continue to skew strongly positive. See this summary for details on the metrics in the tables below.
The aggressive allocation ETF (AOA) lost altitude last week for the first time since the end of June, but the pullback still ranks as noise in an otherwise upward trend.
Note, too, that most of the primary slices of global markets continue to skew positive. Indeed, for a second straight week all the Signal scores in the table below are above zero, which highlights the relative strength coursing through price trends at the moment.
Every party ends eventually, of course. What will be the tell-tale signs? There are many ways to approach this challenge, starting with the Signal scores above. Another is to monitor another proprietary metric on these pages: the Global Trend Indicator (GTI), which analyzes relative trend behavior for the four asset allocation ETFs listed in the first table above.
GTI starts by calculating the ratio of price-trend behavior for the aggressive allocation ETF (AOA) vs. each of its lower-risk counterparts. The average ratio for those three daily time series is GTI, which is compared in the chart above to its 10-, 50-, 100- and 200-day simple moving averages (SMAs). As the lines exhibit a progressive breakdown in trend, the odds rise that an extended slide in markets is unfolding, or is likely to start in the near term.
On that basis, GTI analytics suggest the latest market decline is noise. The most-sensitive (i.e., the most-noisy) relationship are the daily GTI fluctuations (grey line) vs. its 10-day average (red line). You can’t tell much from this pair, other than to recognize that when a strategic slide has started it will begin with GTI falling below its 10-day average. In fact, that support gave way last week for the first time in nearly a month.
Significant? Not yet, but it will be if the next line of support gives way: GTI’s 10-day average (red line) falling below its 50-day average (blue line). At the moment, that downside shift is nowhere on the immediate horizon. In fact, the last time it arrived (late-April) it turned out to be a false signal.
The bottom line: the latest market gyrations are almost certainly noise. What would ratchet up the warning? The 10-day GTI (red line) falls below its 50-day average (blue line), rapidly followed by the 50-day average falling below GTI’s 100-day average (green line).
On that basis, we’re cautious, but still well short of a compelling sign that an extended downside run has started for globally diversified portfolios. ■


